- A diagram is a visual representation that synthesizes and structures information with clear symbols and connections.
- There are multiple types (flow, conceptual, synoptic, Gantt, Venn, Ishikawa, matrix) depending on the objective and discipline.
- Flowcharts use ANSI/ISO symbols (oval, rectangle, diamond, arrows) and good reading and consistency practices.
- Planning ahead, choosing the right type, and updating diagrams ensures usefulness in study, communication, and decision-making.

Diagrams are a powerful way to represent knowledge and processes take a look. Converting ideas, data, or steps into a visual diagram makes them easier to understand., saves time, and reduces ambiguity when communicating. That's why they're used in education, business, engineering, IT, and everyday life.
Beyond being “pretty drawings,” diagrams function as information maps: order, synthesize and show relationships between elements with standardized shapes, lines, arrows, and symbols. Understanding what they are, what types exist, and how to construct them will allow you to use them effectively.
What is a diagram?

A diagram is a graphical representation that simplifies and organizes information on a topic, theory, system, or procedure. It can range from very simple to complex, with few or many logically connected components.
In essence, it acts as a visual summary: condenses concepts and shows links among themselves, making it ideal for studying, explaining, or making decisions. They often use boxes or balloons for ideas and arrows or lines to show connections and flows.
They are used in education, communication, technical and business fields. Its strength is in its clarity: By using a visual grammar (coherent forms and symbols), the reader interprets quickly without getting lost in long texts.
Diagram features

For a diagram to be truly useful it must meet certain characteristics. The keys are simplicity, synthesis and structure so that information flows at a glance.
- Ease: present an idea, phenomenon, strategy or process in a simple and direct way.
- Synthesis: prioritize essential data using keywords and eliminate the accessory.
- Structure: they organize hierarchically (from general to particular) or by classifications and relationships.
- Resources: They use geometric figures, symbols, arrows and lines to organize clearly.
- Versatility: They adapt to very diverse topics, lengths and disciplines.
- Clarity and visual coherence: They use appropriate and consistent symbology to avoid misinterpretations.
When these elements are combined well, Reading becomes fast, logical and noise-free, just what you are looking for when communicating and analyzing.
Types of diagram

There are numerous types, each with a specific purpose. Choosing the right type is half the success because it determines the way information is organized.
1. Flowchart
It is one of the most popular in work and computing. Describe step by step processes or workflows with standardized symbols: oval (start/end), rectangle (action), rhombus (decision) and arrows (direction of flow).
2. Conceptual diagram (concept map)
Ideal for studying or summarizing. Part of a general concept from which secondary notions are derived connected by lines and connecting words. Concepts are usually enclosed in boxes or balloons.
3. Synoptic diagram (synoptic table)
Broader than the conceptual one. From a central theme, it deploys networks of related ideas., often with braces or brackets to group subordinate clauses.
4. Pie chart
It represents proportions in a circle divided into sectors. Each portion shows a percentage and is accompanied by labels with name and number.
5. Block diagram
Visualize systems using blocks and their links. It is not always sequential; highlights how parts connect and often includes details specific to each block.
6. Tree diagram
It shows hierarchies, decisions or probabilities. It starts from a central node and branches into options or scenarios. at each fork.
7. Scatter diagram
In statistics, economics or finance, graphs the relationship between two variables on X and Y axes to detect patterns or correlations.
8. Gantt chart
In project management, plan tasks over time with horizontal bars, showing duration, dependency, and often those responsible.
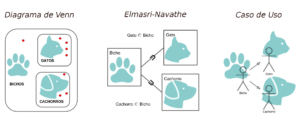
9. Venn Diagram
By means of overlapping circles, indicates intersections and differences between sets or ideas to see what they share and what distinguishes them.
10. Ishikawa diagram (fishbone, cause-effect)
It focuses on the causes of a problem or event. It has a “head” with the effect and main/secondary spines with causes, evoking the shape of a fish.
11. Radial diagram (mental map)
Organize information from the center outwards. A main concept in the center radiates secondary and tertiary ideas connected like branches.
12. Pyramid diagram
Segmented triangle used for hierarchies, stages, quantities or options. Allows you to compare levels or phases of a process or structure.
13. Matrix diagram
Relates two or more dimensions (rows and columns) with symbols or letters. Links objects, tasks, problems, causes, solutions or people to display correspondences.
14. Narrative diagram
Map of elements of a story or novel. Connects plot, characters, narrator and literary devices from the title of the text.
15. Family tree (genogram, family tree)
Widely used in medicine and psychology. Displays family ties and hereditary traits or pathologies of a person or family line.
What is a diagram for?

Diagrams are allies to make the complex easy to understand. They condense a lot of information into a small space and make clear the relationships between elements.
- Study and memorization: They synthesize content in subjects such as history or biology, facilitating retention.
- Professional communication: They explain projects, processes and training in companies and institutions.
- Support for exhibitions: highlight key concepts and their links, accelerating audience understanding.
- decision making: By visualizing relationships and structure, they help detect patterns and evaluate alternatives.
- Organization and planning: they organize tasks and times in business management, IT or projects.
Because they combine text and visuals, are processed faster than a block of plain text and reduce misunderstandings by standardizing symbols.
How to make a diagram
Before you start drawing, it's a good idea to prepare the ground. A little planning prevents rework and gives coherence to the final result.
Previous actions
- Define what you expect to get from the diagram.
- Identify who will use it and for what purpose.
- Set the level of detail required.
- Define the scope or limits of the process to be described.
With this defined, the construction flows much better and decisions about symbols, hierarchy, and connections become more obvious.
Practical steps
- Determine the theme to be represented: gathers key information and identifies main and secondary ideas.
- Select what to include: Prioritize essential concepts and turn them into keywords.
- Choose the type of diagram: according to objective and nature of the content (synoptic, conceptual, flow, etc.).
- make a sketch: outlines the structure, hierarchies and relationships with shapes and arrows.
- Build the final version: Apply colors and, if needed, images; take care with legibility.
When the focus is on a process, add flowchart practices: Use consistent templates, standardized symbols, connect shapes with arrows and share to receive feedback; review and update the diagram if the process changes.
Flowcharts: definition, symbols, history, and best practices
The flowchart visually explains a process or workflow with steps and decisions. Its popularity in engineering, education, programming and projects It is due to its versatility to communicate from the simple to the complex.
Its main advantages are clarity, improved communication and efficient documentation. They translate complex operations into an understandable sequence for teams and stakeholders.
Brief History: In 1921 Frank and Lillian Gilbreth presented process diagrams at the ASME; In 1947 the ASME standardized the symbology; later extended to technology and programming. Kaoru Ishikawa promoted their use in quality. With the advancement of third-generation hardware and languages, their role in classical computing diminished, but gained traction in the business world.
Essential symbols
- Oval: start and end terminal.
- Rectangle: process or action that transforms data.
- Diamond: decision (yes/no, true/false).
- Parallelogram: data input or output.
- Arrows or flow lines: they mark the direction and order of operations.
- Annotation: comment linked to a step for clarification.
- Predefined process: thread defined elsewhere.
- Connectors: on page (labeled circle) or off page (pentagon type “home”) to avoid long lines.
Extended symbols are also used in administrative processes: Triangles for permanent or temporary archiving, trapezoid for data loading, semi-oval for delay, etc.
Standards and recommended reading
ANSI established symbol standards in the 60s that ISO adopted in 1970; ISO 5807 (revision 1985) remains the reference For notation: By convention, the flow is from left to right and from top to bottom; if it's reversed, arrows are required.
Flowchart formats
- Vertical: The process proceeds from top to bottom in sequence.
- Horizontal: the sequence moves from left to right.
- Panoramic: shows the entire process in a single sheet, useful for simultaneous actions and multiple departments.
In addition, there are variants depending on the objective: process (basic), swim lanes (cross-functional), data flow (DFD) and workflow to standardize procedures.
Best Practices
- Keep it on one page if possible.
- Use symbols, shapes and colors consistently.
- Flow from left to right, like reading.
- Involve all areas involved and update frequently.
To build it: define scope (start and end), list activities and decisions in order, assign symbols and test the diagram for errors or ambiguities.
Examples of using the flowchart
In practice, flowcharts are applied in very different scenarios. They are used to design, study and communicate processes effectively. without endless meetings.
- Design and planning: Document steps and events of a new process to ensure a comprehensive overview.
- Process study: Analyze examples to understand optimal sequences and bottlenecks.
- Internal communication: Replace long presentations with a clear visual document of the flow.
- Websites: plan navigation and user journeys between pages and actions.
- DFD (Data Flow Diagram): detail how data, actors and transformations circulate in information systems.
- Decisions Tree: branch out decisions and possible outcomes to choose the best alternative.
- Interfunctional: Visualize contributions from each area and end-to-end relationships.
Among its additional benefits: identify problems and opportunities for improvement, clarify client-supplier interfaces and accelerate the training of new members.
UML and related diagrams
In software modeling, UML provides several useful diagrams. The activity diagram in UML 1.x was derived from the state diagram (the “states” were operations and the transitions, activities at the end of each operation).
In UML 2.0, diagrams evolve: The activity diagram adopts semantics based on Petri netsThe general interaction diagram is based on the activity diagram; and the message diagram (similar in appearance to the UML 1.x activity diagram) incorporates these richer semantics.
Objective of the activity diagram: model workflows and operations. In this framework, an operation is a service offered by an object through an interface, and an interface groups operations with common semantics.
Tools and software for creating diagrams
Today there are a multitude of options for designing diagrams. The choice depends on your use case, level and collaboration needed..
- yEd: General diagram maker with auto-alignment and good flowchart section (Windows, macOS, Linux).
- Microsoft Office: Word, Excel and PowerPoint shapes for basic diagrams; Microsoft Visio for advanced diagrams (including UML).
- LibreOffice Draw: Free alternative for various diagrams, similar to Visio.
- GitMind, SmartDraw, XMind: Rich template solutions; XMind excels at mind mapping.
- Miro and Lucidchart: online collaborative environments for co-creating and maintaining flowcharts and other types.
- PSeInt: designed for students taking their first steps in algorithms with pseudocode and diagrams.
- Free DFD: allows you to run flowcharts for algorithm analysis purposes.
- Interactive apps like iBoske: they guide the user through steps based on decisions to reach a final result.
Whatever the tool, prioritize consistent templates, collaboration and versions to keep your diagrams alive and useful.
Standards, expanded symbology and flow direction
In addition to basic symbols, extended conventions are used in administrative documentation. They help represent media, supports and states of documents:
- Ellipse: start and end of the diagram.
- Square/rectangle: control process or form/documentation (sometimes with specific proportions).
- Continuous line: flow on paper support; dashed line: digital flow.
- Small rectangle: means of payment (check, promissory note).
- Triangle lower base: final file; inverted triangle: temporary file.
- Semi-oval: delay; trapezoid: data loading; hexagon: process not represented; pentagon: connector; cross of diagonals: destruction of forms and recreation of actions.
The recommended flow direction is from left to right and from top to bottom; If you reverse the direction, use explicit arrows to avoid confusion, as stated in the regulations.
Related topics
If you're interested in going deeper, there are related concepts that complement the practice of diagramming and modeling. Exploring them opens doors to more advanced techniques:
- DRAKON, Unified Modeling Language (UML), Workflow, Petri net, Sequence diagram, Algorithm, Programming, Programming problem solving, Pseudocode.
- Control structures: loop, for loop, while loop, repeat loop, infinite loop, structured programming.
Key sources and references
To expand, works such as Duncan (2013), “The Diagram Book: 50 Visual Solutions for Problem Solving”, and Fau (2023), “How to study with graphs, diagrams and charts”. The notes of the University of Granada on block diagrams and documentation on ISO 5807 and ANSI standards.
With all the above, it is clear that diagrams are not mere decoration: They are tools of thought and communication that allow you to learn, explain, optimize, and make better decisions, from a conceptual map for studying to a flowchart with ISO standards for auditing processes.