Probability distributions are fundamental tools in the field of statistics and probability theory. They allow us to describe and model random phenomena based on observable data. These distributions are used in multiple disciplines, from scientific research to business analysis and even artificial intelligence. Below, we'll explore in depth what probability distributions are, their types, and applications.
Definition of probability distribution
An probability distribution It is a mathematical function that provides the probability that a random variable will take on a specific value or set of values. In other words, it's a way of assigning probabilities to the possible outcomes of a random experiment. These distributions can be discrete or continuous, depending on the nature of the data.
Random variables
Before going into probability distributions, it is essential to understand the concept of random variablesA random variable is a phenomenon whose outcome is uncertain. For example, the roll of a die can be considered a random variable, since the outcome (1, 2, 3, 4, 5, or 6) is uncertain until the experiment is conducted.
Random variables are divided into two main categories:
- Discrete random variables: They take a finite or countable set of values. Example: the number of heads when tossing three coins.
- Continuous random variables: They can take any value within a range. Example: a person's height measured in centimeters.
Types of probability distributions
Discrete probability distributions
Probability distributions discreet They are used when the random variable can take on a limited number of values. One of the most common examples is the Poisson distribution, which models the number of events that occur in a fixed time interval. Below, we'll review some important discrete distributions:
Bernoulli distribution
La Bernoulli distribution It is the simplest case of a discrete probability distribution. It is used to model experiments that have only two possible outcomes: success (1) or failure (0), such as tossing a coin. The probability of success is called p, and the probability of failure is denoted as 1-p.
Binomial distribution
La binomial distribution is an extension of the Bernoulli distribution where multiple independent experiments (n throws) are carried out. The probability of obtaining a specific number of successes in n Attempts can be calculated using the formula:
P(X = k) = C(n, k) P^K (1 – p)^(n – k)
where C(n, k) is the binomial coefficient.
Poisson distribution
La Poisson distribution It describes the number of events that occur in a fixed interval of time or space. It is useful when these events occur independently. The formula for calculating probability is:
P(X = k) = (λ^k * e^-λ) / k!
where λ is the average number of events in a fixed interval, and e It is the base of the natural logarithm.
Continuous probability distributions
Probability distributions continuous They are used when the random variable can take any value within a given range. Some examples are:
Normal distribution
La normal distribution, also known as the Gaussian distribution, is one of the most important in statistics. It is characterized by its bell shape and two parameters: the mean (μ) and the standard deviation (σ). Approximately 68% of the data fall within one standard deviation of the mean.
Exponential distribution
La exponential distribution It is used to model the time between events in a Poisson process. It is useful in contexts where the waiting time between events is analyzed. The formula for the probability density function is:
f(x; λ) = λ * e^(-λx) for x ≥ 0
Continuous uniform distribution
La continuous uniform distribution Describes situations in which all intervals within a specific range are equally likely. For example, when selecting a random number between 0 and 1, any number has the same probability of being chosen. The density function is:
f(x) = 1 / (b – a) for a ≤ x ≤ b
Cumulative distribution functions
La cumulative distribution function (FDA) is essential for understanding probability distributions, as it provides the cumulative probability that the random variable is less than or equal to a specific value. For a random variable X, the FDA defines it as:
F(x) = P(X ≤ x)
Such a function can be derived from the probability mass function (for discrete distributions) or from the probability density function (for continuous distributions).
Properties of probability distributions
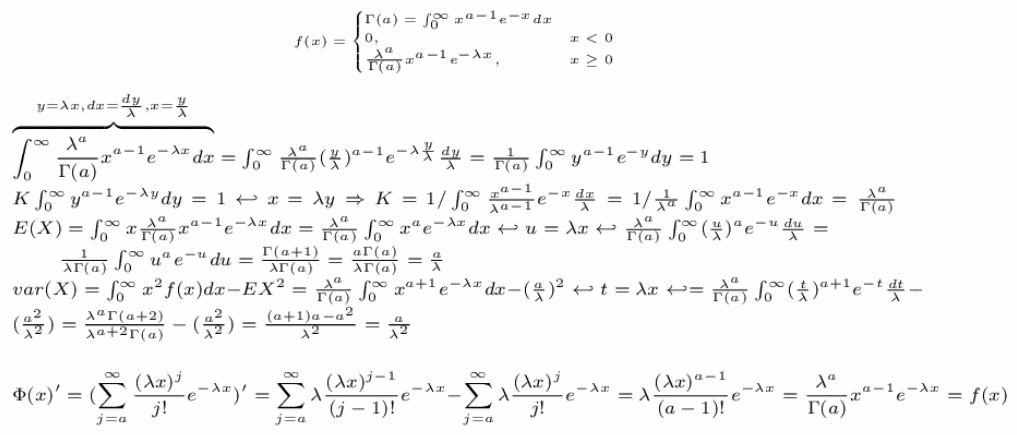
Mathematical expectation
La mathematical expectation, or mean, is one of the most important properties of probability distributions. It describes the average value expected when a random experiment is performed multiple times. For a discrete random variable:
E(X) = Σ x * P(X = x)
And for a continuous variable:
E(X) = ∫ x * f(x) dx
Variance and standard deviation
La variance measures the dispersion of the values of the random variable with respect to its mean. It is defined as:
Var(X) = E[(X – E(X))^2]
La standard deviation, on the other hand, is the square root of the variance and represents the average amount of deviation of the values from the mean.
Applications of probability distributions
Probability distributions have applications in all kinds of fields. Some of the most common are:
Statistics and research
In scientific research, probability distributions are used to analyze experimental data. They allow researchers to formulate hypotheses and determine the validity of their results through statistical testing.
Finance and economics
In finance, probability distributions are crucial for making investment decisions, managing risks, and evaluating asset performance. Tools such as Monte Carlo analysis use these distributions to model uncertainties in financial projections.
Engineering and manufacturing
In engineering, probability distributions help ensure product quality and reliability. They are used in quality control and failure analysis to optimize processes and reduce variability.
Artificial intelligence and machine learning
Probability distributions are fundamental to machine learning. They are used in classification and regression algorithms, and in the development of probabilistic models that allow data-driven inferences to be made.
Probability distributions are an essential component of data analysis and decision-making in a world filled with uncertainty. Understanding how they work and how they are applied is crucial to addressing challenges across diverse disciplines. In an increasingly data-driven environment, the ability to work with probability distributions will become increasingly valuable for those seeking to interpret data and predict outcomes.